The first week of September has been more or less flat in the US stock markets. Once again we see a lot of observers call for the next crash or bear market based on all kind of indications. Today we will join the dance and take a look at margin debt, but let’s start with the current chart for the Nasdaq (click for larger image):

As expected, the market is consolidating its recent rally. As long as the Nasdaq stays above its July highs it will be well positioned for another push higher once the Earl and MoM indicators bottom out. That could take another week or so. On the upside, the 4700-4800 area is coming within reach. To the downside a drop to 4350 is possible if we get a deeper pullback. Both are possible, but this market has shrugged off a lot of “bad” news this summer, suggesting that the path of least resistance remains up.
Despite new record highs investors keep seeing plenty reasons why the market “should” go down: the Fed is tapering, the VIX is too low,… and this NYSE margin debt chart has popped up everywhere last week (click for larger image):
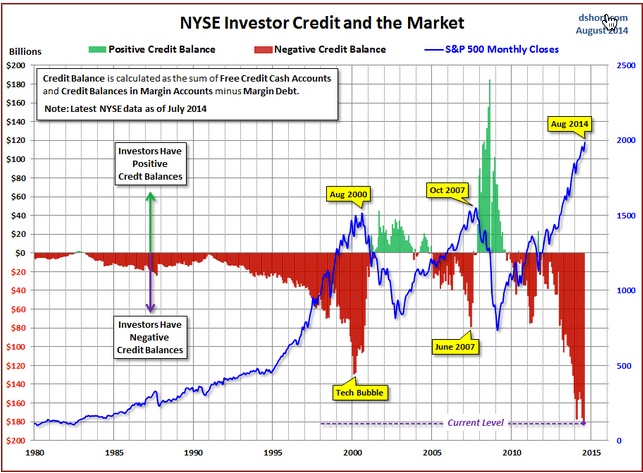
Is this something to worry about? Let’s have a look. The data on which the chart was based can be found here. More complete FINRA data (combines Nasdaq and NYSE) can be found here. Based on the FINRA data there is currently a total $499 billion in margin debt versus $334 billion in free credit balances, making for a net margin debt of $165 billion. That’s about 1% of GDP and only 0.6% of the current $26 trillion market cap (Nasdaq + NYSE).
Comparing this with earlier market peaks:
* October 2007: margin debt $345 billion vs free credit balances of $343 billion (NYSE)
* March 2000: margin debt $279 billion vs free credit balances of $150 billion (NYSE)
* Aug 1987: margin debt $42 billion vs free credit balances of $4 billion (NYSE)
* 1929: gross margin debt reportedly reached 12% of GDP, almost 5 times higher than today (source)
We see no consistent pattern in these peaks. In 1929 gross margin debt was 5 times higher than it is now. In 1987 gross margin debt was 10 times higher than available free credit balances (which means there was very little cash to absorb any panic selling). And in October 2007 there was almost no net margin debt at the peak, there was actually more cash than there is now.
Also note that in 1984 gross margin debt was more than double the “normal” rate seen in 1970s. But stocks just kept going up for another 15 years.
It looks like margin debt is a very unreliable indication. This could be for a number of reasons:
* Current margin debt rates are extremely low, as low as 0.59% for large accounts (source). With many stocks/bonds yielding 2%, 5% or more it cannot be a surprise that margin debt is higher than average. Some investors are simply taking the free lunch that the central banks have been handing out.
* New instruments may make free credit balances look lower than they actually are. With transaction costs much lower than 10-20 years ago, an investor who sells stocks with the intention of buying them back after a few weeks, may now park the money into an ETF like $SHY rather than stay in cash for a few weeks. This can have the effect of making net margin debt look higher than it is.
* Inverse ETF make it possible to hedge a portfolio without going into cash. An investor can even use margin to hedge his portfolio with inverse ETFs. That throws a monkey wrench into the margin debt equation. Rising margin debt is no longer what it was 20 years ago.
We can always find good looking reasons and justifications for being bearish. Charts like margin debt look convincing, but are they? Margin debt could easily reach $1 trillion before this bull market dies. Nobody knows.
Good luck,
Danny


Nice post.
Imo, the Nasdaq should stop soon at the ‘monthly’ closing high level of 4,698 !
If it does not stop there, then we go parabolic towards the all time closing high of 5,048 / intraday all time high of 5,132 !!
What is your opinion / probabilities of these 2 scenarios ?.
Also, do you think it will stop at the all time high or exceed it ?
Hi,
Welcome.
I have rated the probabilities for various blow-off peak scenarios in my recent post here: https://lunatictrader.wordpress.com/2014/08/27/the-case-for-dow-32000-updated/
You may also be interested in this post comparing the current market with the 1920s. The correlation remains very high: https://lunatictrader.wordpress.com/2014/01/14/1920s-again/
Danny